Bought for $86.8M. Sold for $70.5M
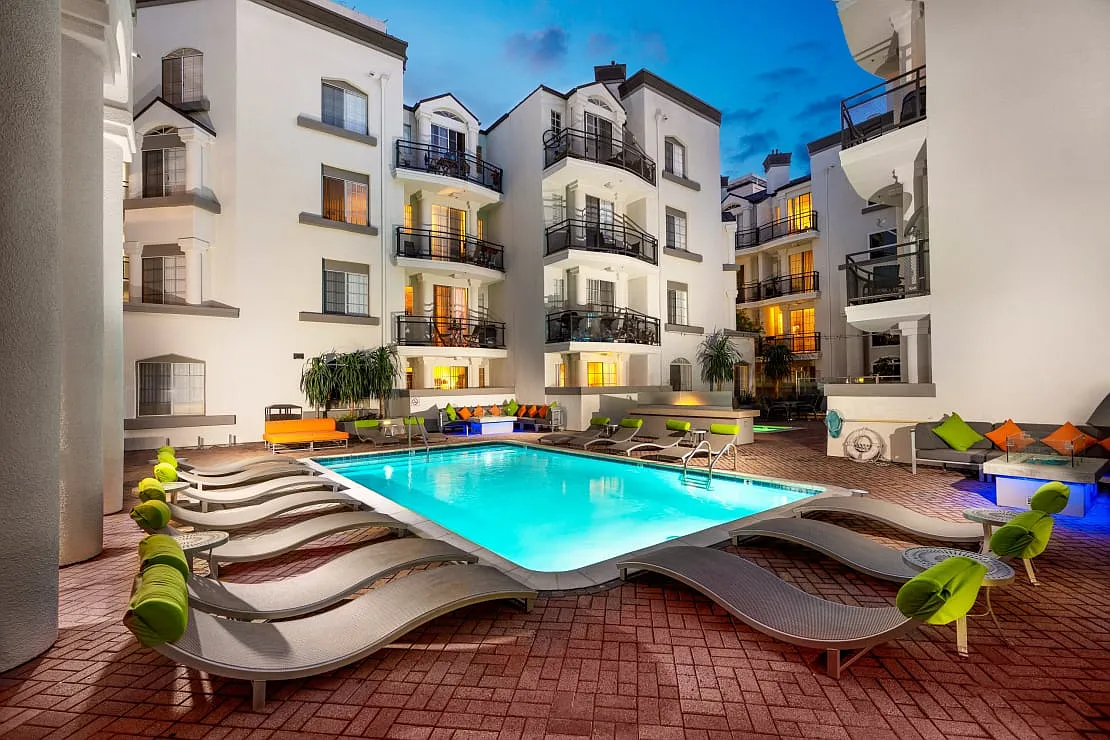
Six years later, this 169-unit Miracle Mile apartment building sold for 19% less.
At a glance
confirmed, Aug 5 2026
30 studio · 48 one-bed · 91 two-bed
per door
168,133 gross SF
reinforced concrete, 4 stories
1.53 acres · R4 zoning
What matters
- $70.49M at $417K/door.Pacific Urban Investors (a $5.6B national institutional buyer) closed August 5, 2026 on 169 units of 1990 mid-rise in the Miracle Mile. Berkadia brokered the sell side for Sares-Regis Group. $16.3 million loss: The building sold for 19% less than its 2020 purchase price.
- The market changed:Higher interest rates, expanding cap rates and Measure ULA. On top of that we have policies that are not investor friendly.
- AB 1482 applies. RSO does not.Built in 1990, this building sits outside LARSO. AB 1482 caps annual increases at 5% + CPI (max 10%).
- ULA tax: $3.88M out of pocket, day one. The 2026 price was only 8% above what the building sold for in 2013. Heitman paid $65 million in 2013.
Deal stats
The Location
630 Masselin Ave sits one block west of La Brea in the Miracle Mile, zip code
Median household income within one mile runs $105,599. The daytime employment base within three miles is 302,858 workers.
The Setup
169 units across four stories of reinforced concrete, built
1990. Unit mix is 30 studios (525 avg SF), 48 one-bedrooms (739 avg SF), and 91 two-bedrooms (1,114 avg SF). The two-bedroom units dominate at 54% of the unit count and carry the largest average footprint in the building, which skews average unit SF up to 916.
The Math the Broker Is Pitching
The database contains no stated CAP rate, no GRM, no T-12 actuals, and no proforma from the OM. What we have is a confirmed sale price of $70.49M and two rent data points from CoStar: a market rent peg for the subject property of $3,212/unit/month and a submarket average of $2,822/unit/month.
| Scenario | Monthly Rent / Unit | Gross Annual | NOI at 40% Expense | Implied CAP |
|---|---|---|---|---|
| Subject market rent (CoStar) | $3,212 | $6.51M | $3.91M | 5.55% |
| Submarket average | $2,822 | $5.72M | $3.43M | 4.87% |
| Subject vacancy-adjusted (6.5%) | $3,212 | $6.08M | $3.65M | 5.18% |
At the $3,212 subject market rent with a 6.5% vacancy and a 40% expense load, the implied CAP is around 5.18%. At the submarket average of $2,822, it drops to the high 4s.
What an Operator Sees
Thirteen years of appreciation were nearly erased.
The building sold for $65 million in 2013, increased to $86.8 million in 2020, and then fell back to $70.5 million in 2026. After 13 years of rent growth, inflation and property improvements, it was worth only $5.5 million. 8.4% more than its 2013 sale price.
You can buy a good building in a strong location, renovate the units, improve operations and increase rents and still lose money if you buy wrong.
The 2020 buyer paid approximately $513,000 per unit and financed roughly 75% of the acquisition. Six years later, the building sold for approximately $417,000 per unit. That $16.3 million decline represented about 75% of the original equity invested, before considering renovations, ULA or closing costs.
The lesson for me is simple: a good asset does not automatically make a good investment. If the basis is too high, the deal may depend on low interest rates, continued rent growth and massive optimism.
This is why I would rather miss a deal than overpay. And this is why I have not transacted since 2019 and only did a ground up development and sold an asset in 2023. You make most of your money when you buyand leverage can magnify a mistake much faster than operations can repair it. As Howard Marks says "Leverage + Volatility = Dynamite"
I research these transactions to sharpen my own investment strategy and share what I find so Los Angeles owners, brokers and investors can debate the market with better information.
Know one other LA owner who'd want this deal? Forward this — reply with their email and I'll add them.
Property and transaction data: CoStar Research.
Write to David Safai at David@AtlasBrief.La
Appeared in the Sept. 6, 2026 edition of The Tape.